
Markets · Microsoft
Midterm elections deliver a ‘blue wave.’ The stock market sees green.
Wall Street finds reasons to cheer the Democrats’ sweep. Plus: Microsoft’s AI-era buyouts and a retiree’s appetite for a “free lunch.”
Markets, AI, tech & space - curated every morning
31 stories · 14 outlets · 276 headlines scanned · 15 multi-source
No stories match your search.
Markets · Microsoft
Wall Street finds reasons to cheer the Democrats’ sweep. Plus: Microsoft’s AI-era buyouts and a retiree’s appetite for a “free lunch.”
Markets · Market
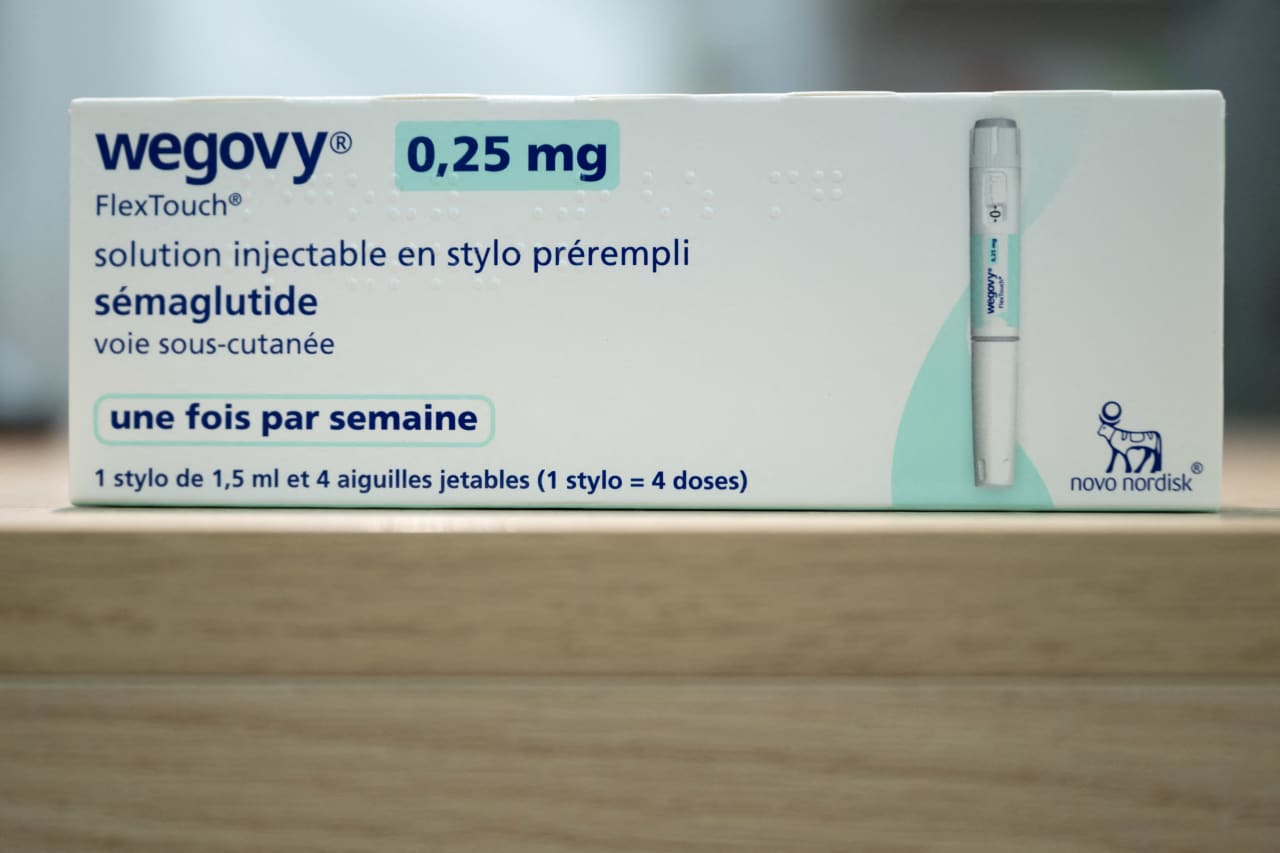
Wayfair said its sales jumped 10% in the third quarter as the retailer posted its strongest quarter since the pandemic.
Markets · Fed
Unexpectedly hot jobs data could affect the number and timing of future rate hikes
Markets · AMD
AMD reported better-than-expected third-quarter results, driven by booming sales of AI chips
Binance has revealed more details about the cyber attack that resulted in the loss of $6.34 billion in digital assets.
In May 2026, four Russian military satellites came close to ICEYE-X36, a private synthetic aperture radar satellite widely believed to be providing battlefield intelligence for Ukraine, in an apparently aggressive and risky "grey zone"...
If you already have a compatible e-reader, the $35 Kindle Click could be all the upgrade you need.
With countless VPN options on the market, finding the best vpn service that reliably nails speed, streaming support, and bulletproof security can be the proverbial minefield. NordVPN is one of our top choices for a VPN service, and right...
Last close · 5-day trend
S&P 500 rose 0.36% to 7,568.92; Nasdaq +0.83%; Dow Jones -0.38%.
IHSG rose 0.32% to 4,919.77.
| AMDAMD | 483.90 | +3.65% | |
| MSFTMicrosoft | 520.99 | +2.74% | |
| MUMicron | 855.10 | +2.58% | |
| METAMeta | 621.03 | +2.36% | |
| NVDANvidia | 206.69 | +2.29% | |
| STXSeagate | 606.38 | +2.13% | |
| AMZNAmazon | 250.69 | +2.06% | |
| TSMTSMC | 404.80 | +1.55% | |
| INTCIntel | 60.55 | +0.97% | |
| GOOGLGoogle (Alphabet) | 280.03 | +0.37% | |
| BRK-BBerkshire Hathaway | 557.07 | +0.17% | |
| MARMarriott | 416.38 | +0.02% | |
| IBMIBM | 250.04 | -0.98% | |
| KOCoca-Cola | 94.80 | -1.07% | |
| TSLATesla | 398.50 | -1.32% | |
| AAPLApple | 331.90 | -1.90% |
| PGEOPertamina Geothermal | 965 | +10.92% | |
| ANTMAneka Tambang | 2,600 | +8.33% | |
| BBCABank Central Asia | 4,930 | +1.86% | |
| BBRIBank Rakyat Indonesia | 2,690 | +1.13% | |
| BMRIBank Mandiri | 3,600 | +0.28% | |
| TLKMTelkom Indonesia | 1,885 | +0.27% |
SpaceX Private company - no ticker; covered in the Space & Aircraft section
Live chart, trading signals & long-term value for your watchlist · analysis updated 2026-11-04 20:04
Tip: hover any dotted-underlined label for a quick definition. Everything here is education, not a recommendation.
What it is. Trading tries to profit from price swings over days to weeks, so it leans on the chart (trend, momentum, support/resistance). Investing means owning a share of a business for years, so it leans on the business itself (profits, growth, debt) and the price you pay (valuation).
How to read it. Use the Trading desk to time entries and exits; use Long-term value to decide WHAT is worth owning. Many people combine them: pick quality businesses, then buy on pullbacks.
Watch out. Short-term trading is hard; most beginners do better starting with long-term investing in small amounts.
What it is. The overall direction of the market, judged here by the index (S&P 500, IHSG) versus its 200-day average.
How to read it. Index above a rising 200-day average = 'risk-on', buying dips tends to work. Below = 'defensive': smaller positions, more cash, wait for the index to reclaim its average.
Watch out. Roughly 3 out of 4 stocks move with the market, so even a great stock struggles in a falling market.
What it is. Rules that keep losses small: position size, stop-loss, and diversification.
How to read it. A common rule: risk at most 1-2% of your account on one trade (distance to your stop x shares). Hold several unrelated stocks. Only invest money you won't need for years.
Watch out. Averaging down on a falling stock without a plan is the most common way beginners lose big.
What it is. The average closing price over the last N trading days, redrawn every day. It smooths out noise.
How to read it. 20-day = short-term trend, 50-day = medium, 200-day = long-term. Price above all three and 20 > 50 > 200 is a healthy uptrend. Averages often act as support in uptrends.
Watch out. Averages lag: they confirm a trend after it starts, they don't predict it.
What it is. Our one-word summary of where price sits relative to its 50 and 200-day averages.
How to read it. Uptrend: price > 50-day > 200-day. Downtrend: the reverse. Correcting: still above the 200-day but fell below the 50-day (a dip in a bigger uptrend). Recovering: below the 200-day but bounced above the 50-day. Turning up: above both while the 50-day is still under the 200-day. Weakening: below both while the 50-day is still above the 200-day.
Watch out. Trends can flip quickly around earnings or big news.
What it is. Compares the size of recent up-days with recent down-days over 14 sessions, on a 0-100 scale.
How to read it. Above 70: rose very fast, may pause or pull back. Below 30: fell very fast, a bounce is common. 40-60 is neutral. In strong uptrends RSI often stays 50-80; in downtrends 20-50.
Watch out. 'Oversold' can stay oversold in a crash. Use RSI with the trend, not against it.
What it is. Difference between a fast (12-day) and slow (26-day) exponential average, compared with its own 9-day average (the signal line).
How to read it. MACD crossing above its signal line ('bullish cross') = momentum turning up; crossing below = turning down. We show 'positive' when MACD is above its signal line.
Watch out. Gives many false signals in sideways markets.
What it is. Here: the lowest low (support) and highest high (resistance) of the previous 20 trading days.
How to read it. Traders buy near support and take profit near resistance. A close above resistance is a 'breakout'; below support is a 'breakdown'. A broken level often flips role (old resistance becomes support).
Watch out. Levels are zones, not exact prices. Many traders place stop-losses just below support.
What it is. Average True Range over 14 days divided by price: the size of a normal day's swing.
How to read it. 1-2% = calm (big caps, banks). 3-5% = lively (tech). 5%+ = very volatile. A stop-loss closer than about 1-2x ATR will often be hit by normal noise.
Watch out. Volatility jumps around earnings and in falling markets.
What it is. Shares traded per bar. We compare today with the 20-day average ('volume x avg').
How to read it. A breakout on 1.5-2x normal volume is more trustworthy; a rally on thin volume is weaker. 'Volume spike' = at least 2x normal, often news-driven.
Watch out. Volume early in the trading day is naturally lower than the full-day average.
What it is. The lowest and highest price of the last year, and today's position between them.
How to read it. Near 100%: strong stock, near highs (momentum). Near 0%: weak or out of favour (possible value, possible trouble).
Watch out. A stock near its low is not automatically cheap - check the business (Long-term value).
What it is. Points for price above each average (+15/+20/+25), MACD positive (+15), and the 1-month return (up to +/-15); small adjustments when RSI is extreme.
How to read it. Use it to sort: high scores are stocks the market is currently rewarding; low scores are being sold.
Watch out. It describes the present, it does not forecast.
What it is. Breakout / Breakdown: closed above the 20-day high / below the 20-day low. Golden cross: 50-day average crossed above the 200-day (long-term bullish); Death cross: the reverse. Overbought/Oversold: RSI above 70 / below 30. Pullback in uptrend: an uptrending stock dipped to its 20/50-day average with a calm RSI - a classic 'buy the dip' setup. Volume spike: 2x normal volume.
How to read it. A signal is a reason to look closer, not an instruction to buy or sell. Signals that agree with the market regime work more often.
Watch out. Always decide where you'd be wrong (stop) before acting on a signal.
What it is. Share price divided by earnings per share. Trailing P/E uses the last 12 months; forward P/E uses analysts' estimate for the next 12 months.
How to read it. A P/E of 20 means paying 20 years of current profit. Under ~15 is usually 'cheap', over ~30 'expensive' - but fast growers deserve higher P/Es, and banks/commodities usually trade lower.
Watch out. Low P/E can mean profits are about to fall (value trap). Compare with peers and the stock's own history.
What it is. P/E divided by expected annual earnings growth (in %).
How to read it. Lets you compare a fast grower with a slow one. Under 1 is attractive, 1-2 fair, above 2-3 pricey.
Watch out. Depends on growth forecasts, which are often too optimistic.
What it is. Market value divided by book value (assets minus liabilities).
How to read it. Banks around 1-2x book are common; far above that needs very high ROE to justify. Tech companies often trade at high P/B because their value is in intangibles.
Watch out. Not meaningful for companies with little or negative book value.
What it is. Net income divided by shareholders' equity - how efficiently the company turns your capital into profit.
How to read it. Consistently above 15-20% often signals a strong business ('moat').
Watch out. Heavy debt or share buybacks can inflate ROE (very high values like 100%+ usually mean small equity).
What it is. Net income divided by revenue.
How to read it. Software/chips can earn 20-50%+; retailers 2-5%. Compare within an industry; rising margins are a good sign.
Watch out. One-off gains or losses can distort a single year.
What it is. Latest quarter vs. the same quarter a year earlier.
How to read it. Steady double-digit growth plus high margins is the profile of long-term compounders.
Watch out. One quarter is noisy; look for consistency.
What it is. Total debt divided by shareholders' equity.
How to read it. Low debt means the company survives bad years without diluting or selling assets.
Watch out. Banks are financed with deposits, so this ratio doesn't apply to them.
What it is. Free cash flow (operating cash minus capital spending) divided by market capitalisation.
How to read it. Like an 'earnings yield' in real cash. It's what can fund dividends, buybacks and growth.
Watch out. Big investment years temporarily lower FCF. Skipped for ADRs reporting in another currency.
What it is. Annual dividends per share divided by the share price.
How to read it. Good for income investors. Growth companies often pay little and reinvest instead.
Watch out. A very high yield (8%+) often comes from a falling price and may be cut.
What it is. Mean of professional analysts' 12-month price targets.
How to read it. A useful sentiment check: +20% or more means analysts see clear upside.
Watch out. Targets follow the price and are often too optimistic; treat as one input only.
What it is. Compound annual growth rate of the dividend-adjusted price.
How to read it. Shows what holding the stock actually delivered. Compare with the index.
Watch out. Past returns don't guarantee future ones; a stock that already ran a lot may be expensive now.
What it is. Today's price vs. the highest close of the last ~5 years.
How to read it. Investors look for strong businesses temporarily 20-40% off their highs.
Watch out. Make sure the business, not just the price, is still healthy.
What it is. Weighted mix: ROE (30%), net margin (20%), revenue growth (20%), earnings growth (10%), low debt (20%).
How to read it. 60+ = strong business; below 40 = weak or struggling.
Watch out. Based on recent numbers only; read the company story too.
What it is. Weighted mix: forward P/E (27%), PEG (18%), FCF yield (18%), P/B (9%), analyst upside (18%), dividend (9%).
How to read it. 55+ = reasonably priced or cheap; below 35 = expensive.
Watch out. Cheap stocks are often cheap for a reason - pair with the quality score.
What it is. Quality 60+ and valuation 55+ = Quality at a fair price; quality 60+ only = Great business, priced richly; valuation 55+ only = Cheap - check why; valuation under 35 = Expensive vs fundamentals.
How to read it. A shortlist for further research, not a buy list.
Watch out. Read the latest results and news before acting.
S&P 500 is 3.5% above its 200-day average: mixed trend (be selective), RSI 40, 1-month -2.6%.
IHSG is 27.7% below its 200-day average: in a downtrend (defensive: smaller positions, wait for a reclaim), RSI 27, 1-month -20.6%.
Price 20-bar avg 50-bar avg Previous close How to read
Live data isn't reachable. The small helper (livechart.py) starts automatically with the morning/hourly run; to start it now double-click Start Live Charts.bat in the morning-news folder, then press Refresh.
| Ticker | Shares | Avg cost | Price | Today | Value | P/L | P/L % | Weight | |
|---|---|---|---|---|---|---|---|---|---|
| Loading… | |||||||||
Price 20-day 50-day 200-day Resistance Support What are these?
Price 20-day 50-day 200-day Resistance Support What are these?
Price 20-day 50-day 200-day Resistance Support What are these?
Price 20-day 50-day 200-day Resistance Support What are these?
Price 20-day 50-day 200-day Resistance Support What are these?
Price 20-day 50-day 200-day Resistance Support What are these?
Price 20-day 50-day 200-day Resistance Support What are these?
Price 20-day 50-day 200-day Resistance Support What are these?
Price 20-day 50-day 200-day Resistance Support What are these?
Price 20-day 50-day 200-day Resistance Support What are these?
Price 20-day 50-day 200-day Resistance Support What are these?
Price 20-day 50-day 200-day Resistance Support What are these?
Price 20-day 50-day 200-day Resistance Support What are these?
Price 20-day 50-day 200-day Resistance Support What are these?
Price 20-day 50-day 200-day Resistance Support What are these?
Price 20-day 50-day 200-day Resistance Support What are these?
Price 20-day 50-day 200-day Resistance Support What are these?
Price 20-day 50-day 200-day Resistance Support What are these?
Price 20-day 50-day 200-day Resistance Support What are these?
Price 20-day 50-day 200-day Resistance Support What are these?
Price 20-day 50-day 200-day Resistance Support What are these?
Price 20-day 50-day 200-day Resistance Support What are these?
Price 20-day 50-day 200-day Resistance Support What are these?
Price 20-day 50-day 200-day Resistance Support What are these?
Price 20-day 50-day 200-day Resistance Support What are these?
Price 20-day 50-day 200-day Resistance Support What are these?
Tap any row for its chart, 15 related metrics and a plain-English reading. Hover dotted labels for definitions.
TSM TSMCQuality at a fair price
Score 91 · Quality 100 · Valuation 81
Fwd P/E 17.3 · PEG 0.72 · ROE 42% · net margin 51% · dividend 0.9% · analyst target +44% · 5y return +30%/yr · 17% below 5y high
MU MicronQuality at a fair price
Score 88 · Quality 100 · Valuation 76
Fwd P/E 4.1 · PEG 0.16 · ROE 88% · net margin 64% · dividend 0.1% · analyst target +83% · 5y return +65%/yr · 30% below 5y high
BBCA Bank Central AsiaQuality at a fair price
Score 86 · Quality 75 · Valuation 96
Fwd P/E 10.0 · PEG 1.25 · ROE 21% · net margin 53% · dividend 7.6% · analyst target +52% · 5y return -5%/yr · 55% below 5y high
ANTM Aneka TambangQuality at a fair price
Score 86 · Quality 88 · Valuation 85
Fwd P/E 16.9 · ROE 29% · net margin 10% · dividend 8.1% · analyst target +74% · 5y return +7%/yr · 45% below 5y high
BBRI Bank Rakyat IndonesiaQuality at a fair price
Score 85 · Quality 71 · Valuation 99
Fwd P/E 6.0 · PEG 1.07 · ROE 19% · net margin 42% · dividend 14.8% · analyst target +38% · 5y return -2%/yr · 58% below 5y high
Weekly price 200-day average
Weekly price 200-day average
Weekly price 200-day average
Weekly price 200-day average
Weekly price 200-day average
Weekly price 200-day average
Weekly price 200-day average
Weekly price 200-day average
Weekly price 200-day average
Weekly price 200-day average
Weekly price 200-day average
Weekly price 200-day average
Weekly price 200-day average
Weekly price 200-day average
Weekly price 200-day average
Weekly price 200-day average
Weekly price 200-day average
Weekly price 200-day average
Weekly price 200-day average
Weekly price 200-day average
Weekly price 200-day average
Weekly price 200-day average
Quality = ROE, margins, growth, debt. Valuation = forward P/E, PEG, FCF yield, P/B, analyst target, dividend. Tap a row for the 5-year chart, 18 metrics and what they mean.
Rule-based screen from Yahoo Finance data (prices may be delayed; fundamentals refresh about twice a day). Educational only, not financial advice. Do your own research.
Apple, Microsoft, Google, Amazon, Meta, Tesla and the giants

Big US Tech · Amazon
If you already have a compatible e-reader, the $35 Kindle Click could be all the upgrade you need.
I tested over a hundred options—my top picks from Apple, Bose, and Beats stood out from the rest.

Google will offer schools AI tools that purportedly don't give away the answers.

Search queries are growing at their fastest rate in five years, Google parent Alphabet said in its earnings report last week. However, Google's Search revenue growth slowed to 12 percent year over year in the third quarter, down from...
Google has cut ties with the company behind the botnet campaign.
Canva is making significant changes affecting 1,271 people, which is 22 percent of its staff, co-founder and CEO Melanie Perkins announced today. "For some people, this will mean changes to their roles or being asked to relocate to...
AI models, semiconductors and compute
AI & Chips · AI
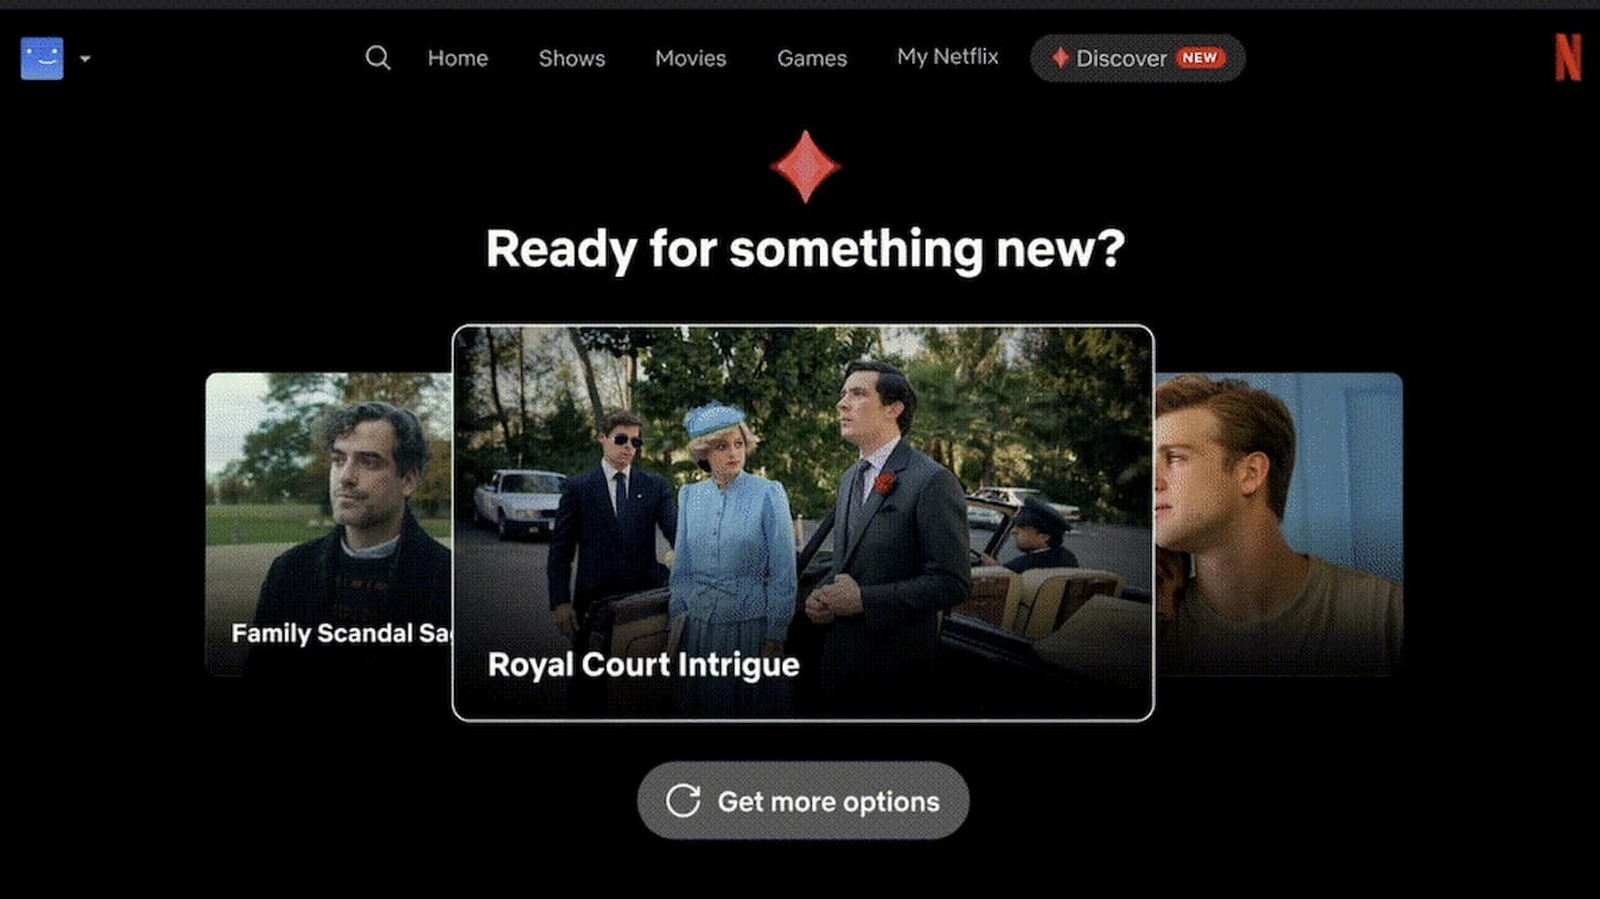
The first experimental feature under the tab will allow users to get recommendations based on what they're currently in the mood for.
Apple will now let Siri AI perform actions across third-party apps. As part of the iOS 27.3 update rolling out on Tuesday, Apple announced developers can now integrate Siri AI's new features in "all apps," allowing the voice assistant to...
In many circles, "Ask Chat" has replaced "Google it," and that's reflected in a new announcement from OpenAI: the volume of search queries run through ChatGPT now equals 20 percent of the volume run through Google. Adam Fry, OpenAI's...
Called FlashProve, the system would let anyone check that an AI response really came from the model it claims to be from.
The first time Mutembei Kariuki thought about how AI models could work in Kenya, his home country, was in 2019. He was attending a conference at the University of Tokyo on the future of AI, and kept hearing about how this technology was...

Humanoids, automation and industrial robots
Robotics · Robot
Ben Waters discusses opportunity charging, battery life, and the infrastructure needed to keep growing robot fleets running.
Tutor Intelligence has raised funding to further develop its picking robots, networked intelligence, and commercial deployments.
Launches, spaceflight and aviation

Space & Aircraft · Satellite
In May 2026, four Russian military satellites came close to ICEYE-X36, a private synthetic aperture radar satellite widely believed to be providing battlefield intelligence for Ukraine, in an apparently aggressive and risky "grey zone"...
With countless VPN options on the market, finding the best vpn service that reliably nails speed, streaming support, and bulletproof security can be the proverbial minefield. NordVPN is one of our top choices for a VPN service, and right...
APOD Science APOD APOD: 2026 November 4 – The… Today’s APOD Archive Submissions Index Search Calendar RSS Education About Discuss APOD Astronomy Picture of the Day Discover the cosmos! Each day a different image or photograph of our...
With hardly a cloud in sight, astronauts had a sweeping view of nighttime lights in the U.S. Midwest.
As of Monday, the U.S. Space Force predicted Swift would re-enter Earth's atmosphere at approximately 3:30 a.m. EST Wednesday, Nov. 4, somewhere within about 21 degrees north or south of the equator — a band that is mostly ocean.

NASA Administrator Jared Isaacman has addressed the ongoing debate about the Hubble Space Telescope’s long-term…
General technology, gadgets and security
Technology · Cyber
Binance has revealed more details about the cyber attack that resulted in the loss of $6.34 billion in digital assets.
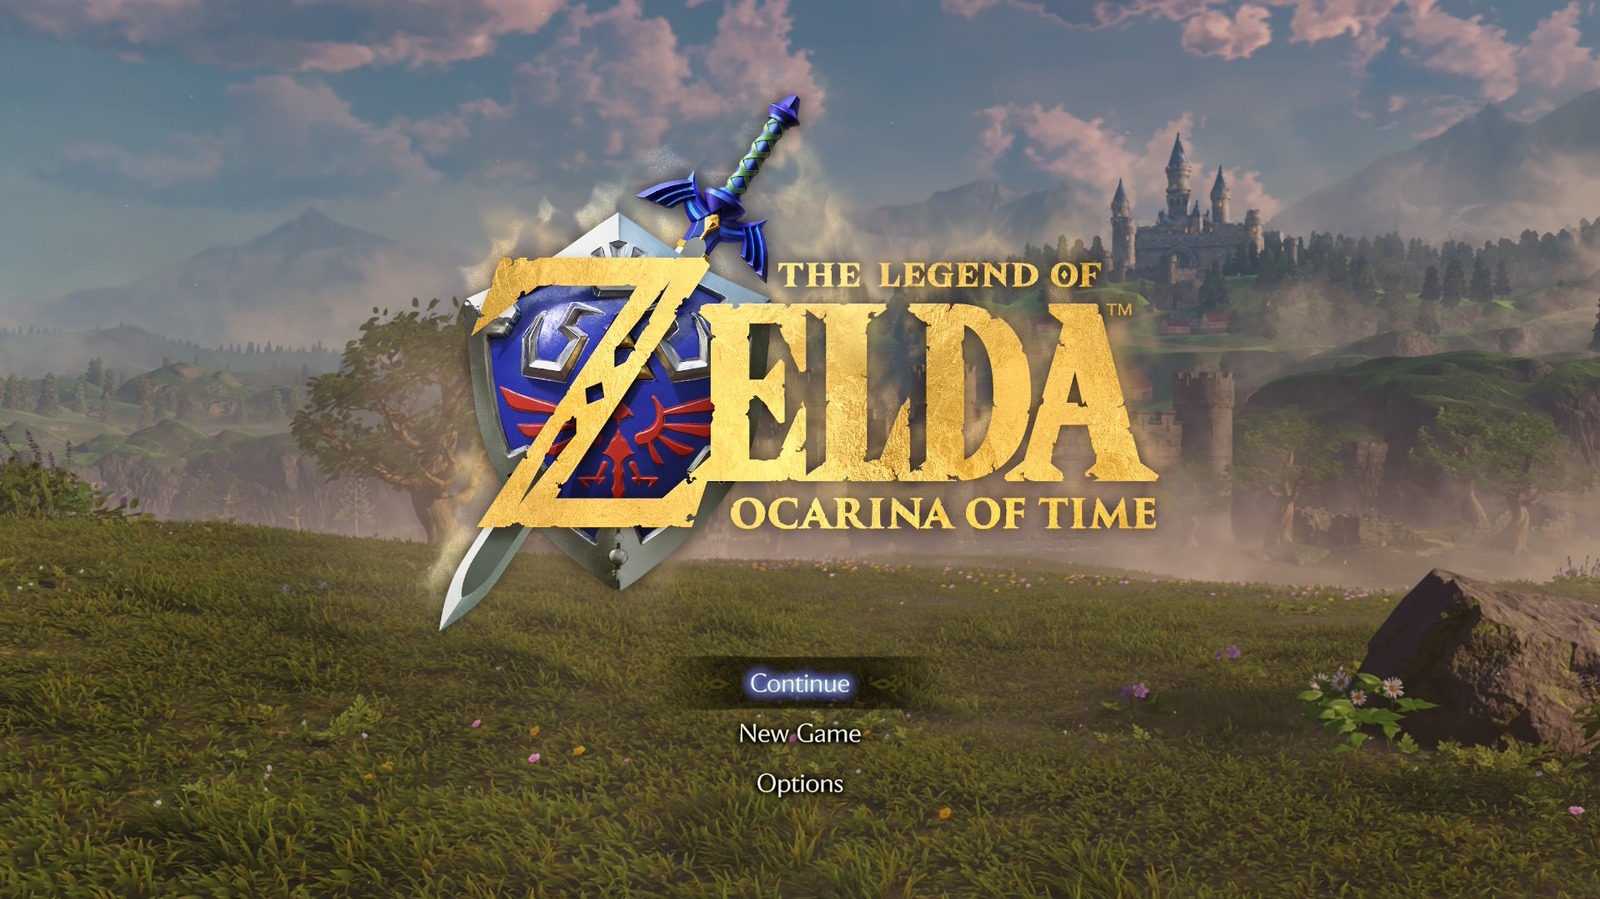
The magic of the original is fully intact while looking and playing better than ever.
Today is the day to join TechCrunch Founder Summit 2026 in Boston's SoWa Power Station. Register now to join this founder-focused conference today.
Canva is cutting 22% of its staff as it faces its 'hardest year' yet.
Influencers, watchdogs, and MAGA pundits are convinced that election fraud is everywhere today, despite a lack of apparent evidence.

Get 20% off with verified Dell promo code, plus today’s coupons for up to $600 off laptops, Alienware monitors, and all things tech.

US and Indonesia market headlines
Markets · Microsoft
Wall Street finds reasons to cheer the Democrats’ sweep. Plus: Microsoft’s AI-era buyouts and a retiree’s appetite for a “free lunch.”
Wayfair said its sales jumped 10% in the third quarter as the retailer posted its strongest quarter since the pandemic.
Unexpectedly hot jobs data could affect the number and timing of future rate hikes
AMD reported better-than-expected third-quarter results, driven by booming sales of AI chips
The Tourism Ministry has stepped up efforts to attract European tourists by developing quality tourism products ...

The welfare of Indonesian farmers is showing a positive trend as the Farmers’ Exchange Rate (NTP) reached 132.60 ...
