Big US Tech · SpaceX
Anthropic sets IPO price range of $70 to $78, looks to start trading Nov. 19, sources say
Anthropic's IPO is expected to come roughly five months after Elon Musk took SpaceX public in a record offering.
Markets, AI, tech & space - curated every morning
32 stories 13 outlets 387 headlines scanned 10 multi-source
No stories match your search.
Big US Tech · SpaceX
Anthropic's IPO is expected to come roughly five months after Elon Musk took SpaceX public in a record offering.
Big US Tech · Robot
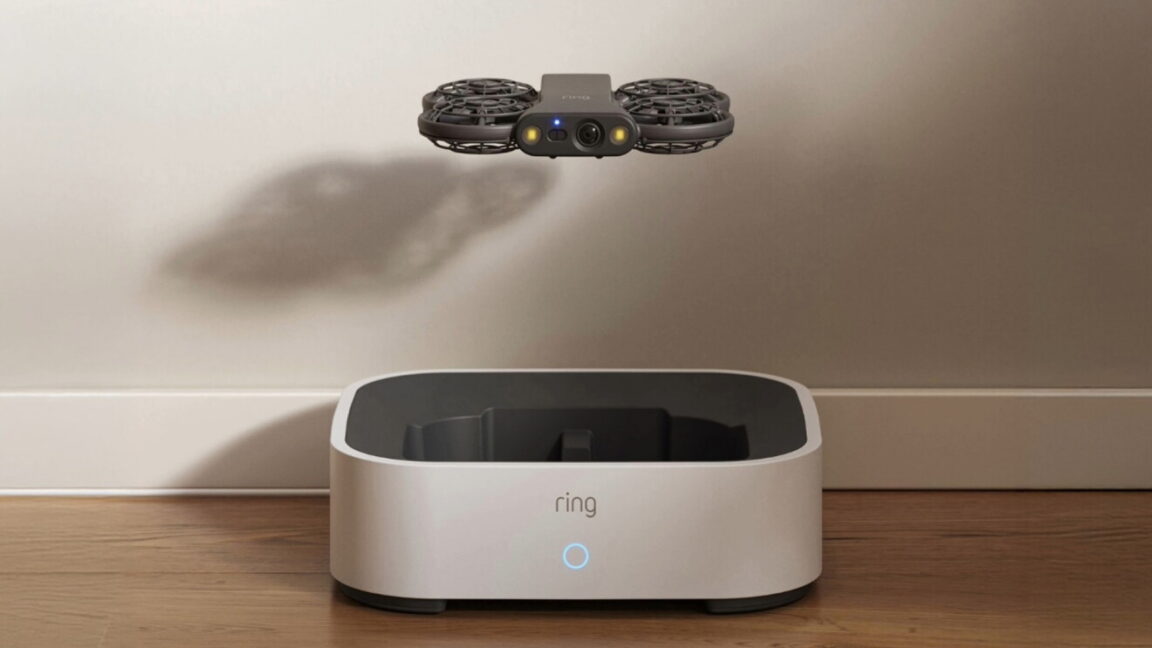
Amazon's $250 Ring Drone Cam flies from room to room to investigate suspicious activity, and can capture footage at night.
Technology · Apple
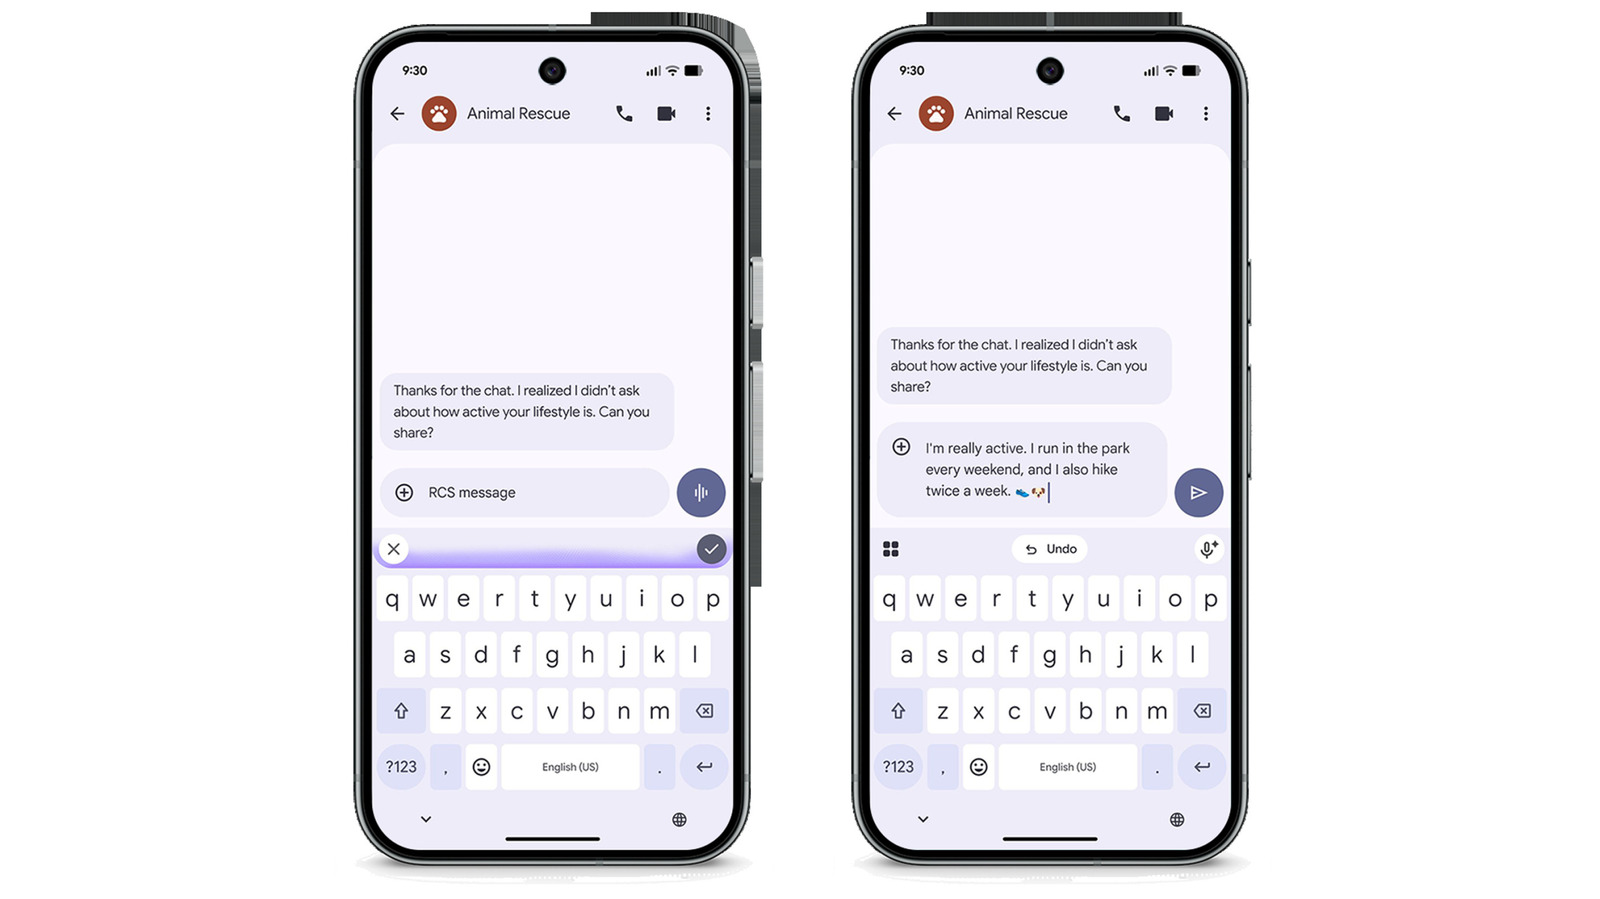
Google's Pixel Tag lets you track lost items with your Android device, similar to Apple's AirTag.

Markets · Nvidia
Joon Kim just joined the Wachtell Lipton law firm last month and now will lead an independent investigation into whether Nvidia’s CEO was…
Last close · 5-day trend
Last close from Yahoo Finance; BI-Rate from the latest Bank Indonesia Board decision.
S&P 500 fell 0.38% to 7,520.93; Nasdaq -0.74%; Dow Jones -0.30%.
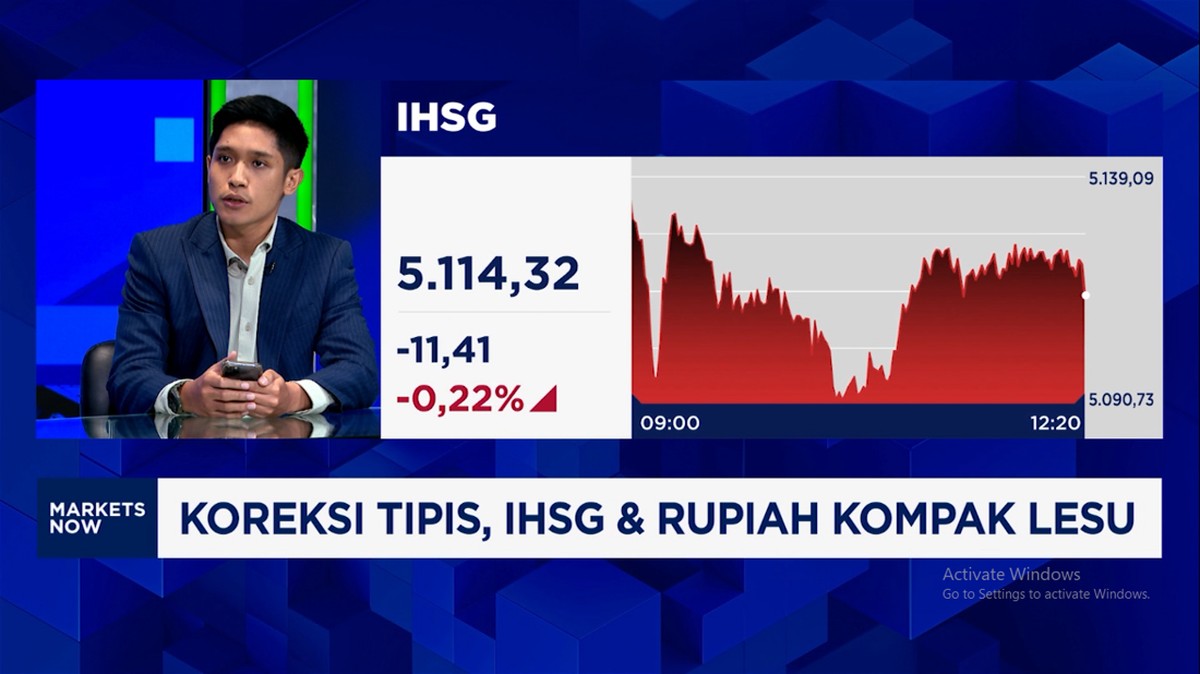
IHSG fell 0.60% to 5,094.83.
| MARMarriott | 428.26 | +2.66% | |
| TSMTSMC | 396.48 | +2.02% | |
| AMZNAmazon | 270.87 | +1.48% | |
| BRK-BBerkshire Hathaway | 583.34 | +1.41% | |
| AMDAMD | 515.21 | +1.30% | |
| KOCoca-Cola | 96.91 | +0.92% | |
| TSLATesla | 379.78 | +0.46% | |
| METAMeta | 641.39 | +0.00% | |
| GOOGLGoogle (Alphabet) | 287.38 | -0.27% | |
| AAPLApple | 348.51 | -0.62% | |
| IBMIBM | 244.53 | -0.64% | |
| STXSeagate | 501.62 | -0.89% | |
| MUMicron | 725.11 | -1.10% | |
| INTCIntel | 58.13 | -2.09% | |
| MSFTMicrosoft | 533.16 | -2.20% | |
| NVDANvidia | 168.89 | -5.47% |
| TLKMTelkom Indonesia | 2,060 | +0.98% | |
| BBRIBank Rakyat Indonesia | 2,830 | +0.35% | |
| BMRIBank Mandiri | 3,740 | -0.27% | |
| ANTMAneka Tambang | 2,750 | -0.36% | |
| BBCABank Central Asia | 5,275 | -0.47% | |
| PGEOPertamina Geothermal | 945 | -1.56% |
SpaceX Private company - no ticker; covered in the Space & Aircraft section
Live chart, trading signals & long-term value for your watchlist · analysis updated 2026-11-11 15:33
Tip: hover any dotted-underlined label for a quick definition. Everything here is education, not a recommendation.
What it is. Trading tries to profit from price swings over days to weeks, so it leans on the chart (trend, momentum, support/resistance). Investing means owning a share of a business for years, so it leans on the business itself (profits, growth, debt) and the price you pay (valuation).
How to read it. Use the Trading desk to time entries and exits; use Long-term value to decide WHAT is worth owning. Many people combine them: pick quality businesses, then buy on pullbacks.
Watch out. Short-term trading is hard; most beginners do better starting with long-term investing in small amounts.
What it is. The overall direction of the market, judged here by the index (S&P 500, IHSG) versus its 200-day average.
How to read it. Index above a rising 200-day average = 'risk-on', buying dips tends to work. Below = 'defensive': smaller positions, more cash, wait for the index to reclaim its average.
Watch out. Roughly 3 out of 4 stocks move with the market, so even a great stock struggles in a falling market.
What it is. Rules that keep losses small: position size, stop-loss, and diversification.
How to read it. A common rule: risk at most 1-2% of your account on one trade (distance to your stop x shares). Hold several unrelated stocks. Only invest money you won't need for years.
Watch out. Averaging down on a falling stock without a plan is the most common way beginners lose big.
What it is. The average closing price over the last N trading days, redrawn every day. It smooths out noise.
How to read it. 20-day = short-term trend, 50-day = medium, 200-day = long-term. Price above all three and 20 > 50 > 200 is a healthy uptrend. Averages often act as support in uptrends.
Watch out. Averages lag: they confirm a trend after it starts, they don't predict it.
What it is. Our one-word summary of where price sits relative to its 50 and 200-day averages.
How to read it. Uptrend: price > 50-day > 200-day. Downtrend: the reverse. Correcting: still above the 200-day but fell below the 50-day (a dip in a bigger uptrend). Recovering: below the 200-day but bounced above the 50-day. Turning up: above both while the 50-day is still under the 200-day. Weakening: below both while the 50-day is still above the 200-day.
Watch out. Trends can flip quickly around earnings or big news.
What it is. Compares the size of recent up-days with recent down-days over 14 sessions, on a 0-100 scale.
How to read it. Above 70: rose very fast, may pause or pull back. Below 30: fell very fast, a bounce is common. 40-60 is neutral. In strong uptrends RSI often stays 50-80; in downtrends 20-50.
Watch out. 'Oversold' can stay oversold in a crash. Use RSI with the trend, not against it.
What it is. Difference between a fast (12-day) and slow (26-day) exponential average, compared with its own 9-day average (the signal line).
How to read it. MACD crossing above its signal line ('bullish cross') = momentum turning up; crossing below = turning down. We show 'positive' when MACD is above its signal line.
Watch out. Gives many false signals in sideways markets.
What it is. Here: the lowest low (support) and highest high (resistance) of the previous 20 trading days.
How to read it. Traders buy near support and take profit near resistance. A close above resistance is a 'breakout'; below support is a 'breakdown'. A broken level often flips role (old resistance becomes support).
Watch out. Levels are zones, not exact prices. Many traders place stop-losses just below support.
What it is. Average True Range over 14 days divided by price: the size of a normal day's swing.
How to read it. 1-2% = calm (big caps, banks). 3-5% = lively (tech). 5%+ = very volatile. A stop-loss closer than about 1-2x ATR will often be hit by normal noise.
Watch out. Volatility jumps around earnings and in falling markets.
What it is. Shares traded per bar. We compare today with the 20-day average ('volume x avg').
How to read it. A breakout on 1.5-2x normal volume is more trustworthy; a rally on thin volume is weaker. 'Volume spike' = at least 2x normal, often news-driven.
Watch out. Volume early in the trading day is naturally lower than the full-day average.
What it is. The lowest and highest price of the last year, and today's position between them.
How to read it. Near 100%: strong stock, near highs (momentum). Near 0%: weak or out of favour (possible value, possible trouble).
Watch out. A stock near its low is not automatically cheap - check the business (Long-term value).
What it is. Points for price above each average (+15/+20/+25), MACD positive (+15), and the 1-month return (up to +/-15); small adjustments when RSI is extreme.
How to read it. Use it to sort: high scores are stocks the market is currently rewarding; low scores are being sold.
Watch out. It describes the present, it does not forecast.
What it is. Breakout / Breakdown: closed above the 20-day high / below the 20-day low. Golden cross: 50-day average crossed above the 200-day (long-term bullish); Death cross: the reverse. Overbought/Oversold: RSI above 70 / below 30. Pullback in uptrend: an uptrending stock dipped to its 20/50-day average with a calm RSI - a classic 'buy the dip' setup. Volume spike: 2x normal volume.
How to read it. A signal is a reason to look closer, not an instruction to buy or sell. Signals that agree with the market regime work more often.
Watch out. Always decide where you'd be wrong (stop) before acting on a signal.
What it is. Share price divided by earnings per share. Trailing P/E uses the last 12 months; forward P/E uses analysts' estimate for the next 12 months.
How to read it. A P/E of 20 means paying 20 years of current profit. Under ~15 is usually 'cheap', over ~30 'expensive' - but fast growers deserve higher P/Es, and banks/commodities usually trade lower.
Watch out. Low P/E can mean profits are about to fall (value trap). Compare with peers and the stock's own history.
What it is. P/E divided by expected annual earnings growth (in %).
How to read it. Lets you compare a fast grower with a slow one. Under 1 is attractive, 1-2 fair, above 2-3 pricey.
Watch out. Depends on growth forecasts, which are often too optimistic.
What it is. Market value divided by book value (assets minus liabilities).
How to read it. Banks around 1-2x book are common; far above that needs very high ROE to justify. Tech companies often trade at high P/B because their value is in intangibles.
Watch out. Not meaningful for companies with little or negative book value.
What it is. Net income divided by shareholders' equity - how efficiently the company turns your capital into profit.
How to read it. Consistently above 15-20% often signals a strong business ('moat').
Watch out. Heavy debt or share buybacks can inflate ROE (very high values like 100%+ usually mean small equity).
What it is. Net income divided by revenue.
How to read it. Software/chips can earn 20-50%+; retailers 2-5%. Compare within an industry; rising margins are a good sign.
Watch out. One-off gains or losses can distort a single year.
What it is. Latest quarter vs. the same quarter a year earlier.
How to read it. Steady double-digit growth plus high margins is the profile of long-term compounders.
Watch out. One quarter is noisy; look for consistency.
What it is. Total debt divided by shareholders' equity.
How to read it. Low debt means the company survives bad years without diluting or selling assets.
Watch out. Banks are financed with deposits, so this ratio doesn't apply to them.
What it is. Free cash flow (operating cash minus capital spending) divided by market capitalisation.
How to read it. Like an 'earnings yield' in real cash. It's what can fund dividends, buybacks and growth.
Watch out. Big investment years temporarily lower FCF. Skipped for ADRs reporting in another currency.
What it is. Annual dividends per share divided by the share price.
How to read it. Good for income investors. Growth companies often pay little and reinvest instead.
Watch out. A very high yield (8%+) often comes from a falling price and may be cut.
What it is. Mean of professional analysts' 12-month price targets.
How to read it. A useful sentiment check: +20% or more means analysts see clear upside.
Watch out. Targets follow the price and are often too optimistic; treat as one input only.
What it is. Compound annual growth rate of the dividend-adjusted price.
How to read it. Shows what holding the stock actually delivered. Compare with the index.
Watch out. Past returns don't guarantee future ones; a stock that already ran a lot may be expensive now.
What it is. Today's price vs. the highest close of the last ~5 years.
How to read it. Investors look for strong businesses temporarily 20-40% off their highs.
Watch out. Make sure the business, not just the price, is still healthy.
What it is. Weighted mix: ROE (30%), net margin (20%), revenue growth (20%), earnings growth (10%), low debt (20%).
How to read it. 60+ = strong business; below 40 = weak or struggling.
Watch out. Based on recent numbers only; read the company story too.
What it is. Weighted mix: forward P/E (27%), PEG (18%), FCF yield (18%), P/B (9%), analyst upside (18%), dividend (9%).
How to read it. 55+ = reasonably priced or cheap; below 35 = expensive.
Watch out. Cheap stocks are often cheap for a reason - pair with the quality score.
What it is. Quality 60+ and valuation 55+ = Quality at a fair price; quality 60+ only = Great business, priced richly; valuation 55+ only = Cheap - check why; valuation under 35 = Expensive vs fundamentals.
How to read it. A shortlist for further research, not a buy list.
Watch out. Read the latest results and news before acting.
S&P 500 is 2.6% above its 200-day average: mixed trend (be selective), RSI 44, 1-month -3.7%.
IHSG is 24.1% below its 200-day average: in a downtrend (defensive: smaller positions, wait for a reclaim), RSI 37, 1-month -14.0%.
Price 20-bar avg 50-bar avg Previous close How to read
Live data isn't reachable. The small helper (livechart.py) starts automatically with the morning/hourly run; to start it now double-click Start Live Charts.bat in the morrow-news folder, then press Refresh.
| Ticker | Shares | Avg cost | Price | Today | Value | P/L | P/L % | Weight | |
|---|---|---|---|---|---|---|---|---|---|
| Loading… | |||||||||
Price 20-day 50-day 200-day Resistance Support What are these?
Price 20-day 50-day 200-day Resistance Support What are these?
Price 20-day 50-day 200-day Resistance Support What are these?
Price 20-day 50-day 200-day Resistance Support What are these?
Price 20-day 50-day 200-day Resistance Support What are these?
Price 20-day 50-day 200-day Resistance Support What are these?
Price 20-day 50-day 200-day Resistance Support What are these?
Price 20-day 50-day 200-day Resistance Support What are these?
Price 20-day 50-day 200-day Resistance Support What are these?
Price 20-day 50-day 200-day Resistance Support What are these?
Price 20-day 50-day 200-day Resistance Support What are these?
Price 20-day 50-day 200-day Resistance Support What are these?
Price 20-day 50-day 200-day Resistance Support What are these?
Price 20-day 50-day 200-day Resistance Support What are these?
Price 20-day 50-day 200-day Resistance Support What are these?
Price 20-day 50-day 200-day Resistance Support What are these?
Price 20-day 50-day 200-day Resistance Support What are these?
Price 20-day 50-day 200-day Resistance Support What are these?
Price 20-day 50-day 200-day Resistance Support What are these?
Price 20-day 50-day 200-day Resistance Support What are these?
Price 20-day 50-day 200-day Resistance Support What are these?
Price 20-day 50-day 200-day Resistance Support What are these?
Price 20-day 50-day 200-day Resistance Support What are these?
Price 20-day 50-day 200-day Resistance Support What are these?
Price 20-day 50-day 200-day Resistance Support What are these?
Price 20-day 50-day 200-day Resistance Support What are these?
Tap any row for its chart, 15 related metrics and a plain-English reading. Hover dotted labels for definitions.
BBRI Bank Rakyat IndonesiaQuality at a fair price
Score 92 · Quality 85 · Valuation 98
Fwd P/E 6.5 · PEG 1.07 · ROE 19% · net margin 39% · dividend 14.8% · analyst target +23% · 5y return -1%/yr · 56% below 5y high
TSM TSMCQuality at a fair price
Score 91 · Quality 100 · Valuation 82
Fwd P/E 17.0 · PEG 0.71 · ROE 42% · net margin 51% · dividend 0.9% · analyst target +48% · 5y return +29%/yr · 18% below 5y high
MU MicronQuality at a fair price
Score 89 · Quality 100 · Valuation 79
Fwd P/E 3.5 · PEG 0.16 · ROE 88% · net margin 64% · dividend 0.1% · analyst target +115% · 5y return +58%/yr · 40% below 5y high
NVDA NvidiaQuality at a fair price
Score 84 · Quality 100 · Valuation 68
Fwd P/E 10.6 · PEG 0.22 · ROE 117% · net margin 64% · dividend 0.6% · analyst target +93% · 5y return +41%/yr · 29% below 5y high
ANTM Aneka TambangQuality at a fair price
Score 84 · Quality 88 · Valuation 80
Fwd P/E 19.4 · ROE 29% · net margin 10% · dividend 7.6% · analyst target +65% · 5y return +8%/yr · 42% below 5y high
Weekly price 200-day average
Weekly price 200-day average
Weekly price 200-day average
Weekly price 200-day average
Weekly price 200-day average
Weekly price 200-day average
Weekly price 200-day average
Weekly price 200-day average
Weekly price 200-day average
Weekly price 200-day average
Weekly price 200-day average
Weekly price 200-day average
Weekly price 200-day average
Weekly price 200-day average
Weekly price 200-day average
Weekly price 200-day average
Weekly price 200-day average
Weekly price 200-day average
Weekly price 200-day average
Weekly price 200-day average
Weekly price 200-day average
Weekly price 200-day average
Quality = ROE, margins, growth, debt. Valuation = forward P/E, PEG, FCF yield, P/B, analyst target, dividend. Tap a row for the 5-year chart, 18 metrics and what they mean.
Rule-based screen from Yahoo Finance data (prices may be delayed; fundamentals refresh about twice a day). Educational only, not financial advice. Do your own research.
Apple, Microsoft, Google, Amazon, Meta, Tesla and the giants
Big US Tech · Robot
Amazon's $250 Ring Drone Cam flies from room to room to investigate suspicious activity, and can capture footage at night.
Anthropic's IPO is expected to come roughly five months after Elon Musk took SpaceX public in a record offering.
Microsoft is now rolling out Automatic Super Resolution (Auto SR), an upscaling technology that competes with Nvidia's DLSS, for the Xbox Ally X, Xbox Ally X20, and select Windows Copilot Plus PCs, the company announced today. Auto SR is...
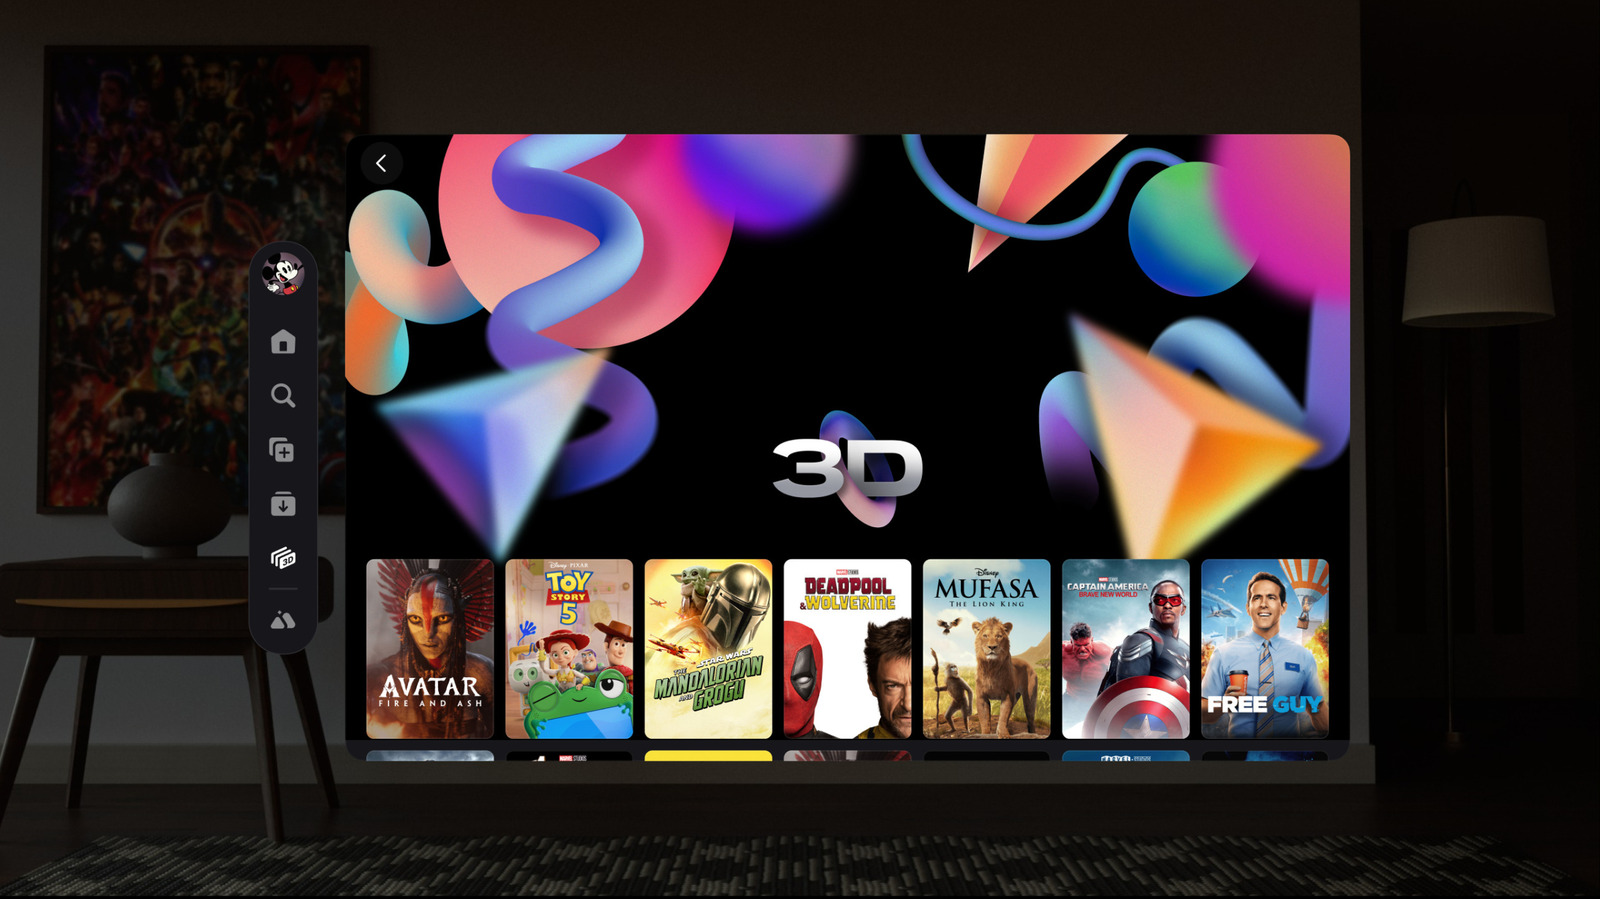
Disney is bringing more than 60 3D movies to the Disney Plus app on Meta Quest. The movies will be available to Disney Plus subscribers as part of an updated Disney Plus app that's rolling out today. The 3D movies you can check out include...
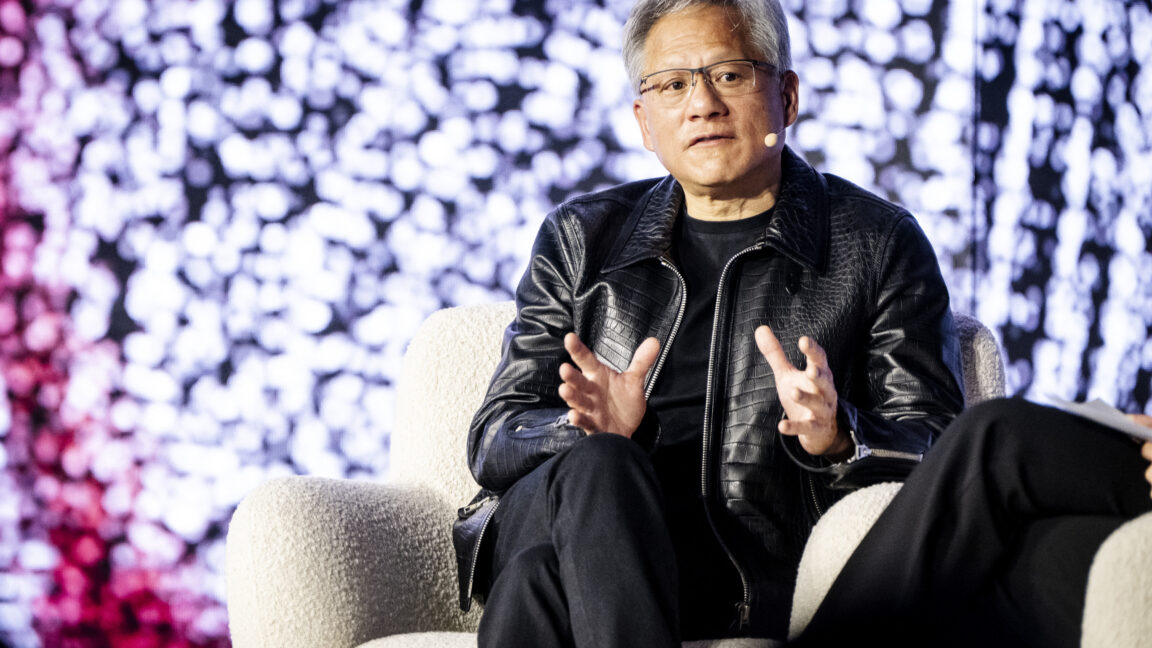
Huang faces a board probe as investors fret over Nvidia’s lack of a clear successor.
Boost your productivity and save with exclusive Google Workspace coupons from WIRED. Get up to 14% off plans for three months, including Starter, Standard, and Plus tiers.

AI models, semiconductors and compute

AI & Chips · AI
This article is brought to you by Queen’s University Belfast . Several teams around the globe are leveraging AI by creating a task force of…
For years, Anthropic has been known for its focus on enterprise and coding tools that attract high-flying corporate clients, inspiring competing frontier labs - like OpenAI, SpaceXSI, and Meta - to copy its strategies. Earlier this year...
New York is preparing to enforce its sweeping AI safety law, requiring major developers like OpenAI and Anthropic to register, disclose safety practices, and report critical incidents or face fines.
The governance experts we talked to say nobody has seen anything like what's unfolding right now.
As espionage targets go, Jensen Huang is perhaps one of the least surprising on Earth. The Nvidia CEO runs one of the world's most valuable companies, controls the in-demand technology fueling the AI boom, and is cozy with presidents...
Humanoids, automation and industrial robots

Robotics · Robotics
Robotics companies are investing heavily in the belief that data will solve the most difficult problems in robotics. Once AI systems have…
Altera and Intel are working to make it easier to connect diverse sensors, turn data into real-time insights, and develop robotics.
As robotics scales across industries, companies need a maintenance strategy to collect and use the right data to minimize downtime.
Launches, spaceflight and aviation

Space & Aircraft · SpaceX
SpaceX is counting down to make history with the launch of its Starship Flight 15 mission on Friday, Nov. 13 , with liftoff scheduled for…
NASA Administrator Jared Isaacman has further explained the decision to standardize the Space Launch System…
The FCC accepted SpaceX's bid for Grain's 800 MHz spectrum, opening review for Starlink Mobile.
On Nov. 10, 2013, Europe's GOCE satellite fell to Earth after four years in orbit mapping the planet's gravitational field. GOCE, its name was short for Gravity field and steady-state Ocean Circulation Explorer, launched in 2009 on a...

A Tesla upfitter has offered to take over Cybertruck lines from the company in a last-ditch effort to save the all-electric pickup from being completely canceled in the middle of 2027. Unplugged Performance, the Hawthorne, California-based...
Seven rockets from four countries are set to launch this week. Starship is set to…
General technology, gadgets and security
Technology · Apple
Google's Pixel Tag lets you track lost items with your Android device, similar to Apple's AirTag.
Discover how to save on T-Mobile Business Internet and phone plans, from sign-up perks and switching rewards to bundled offers and free lines.

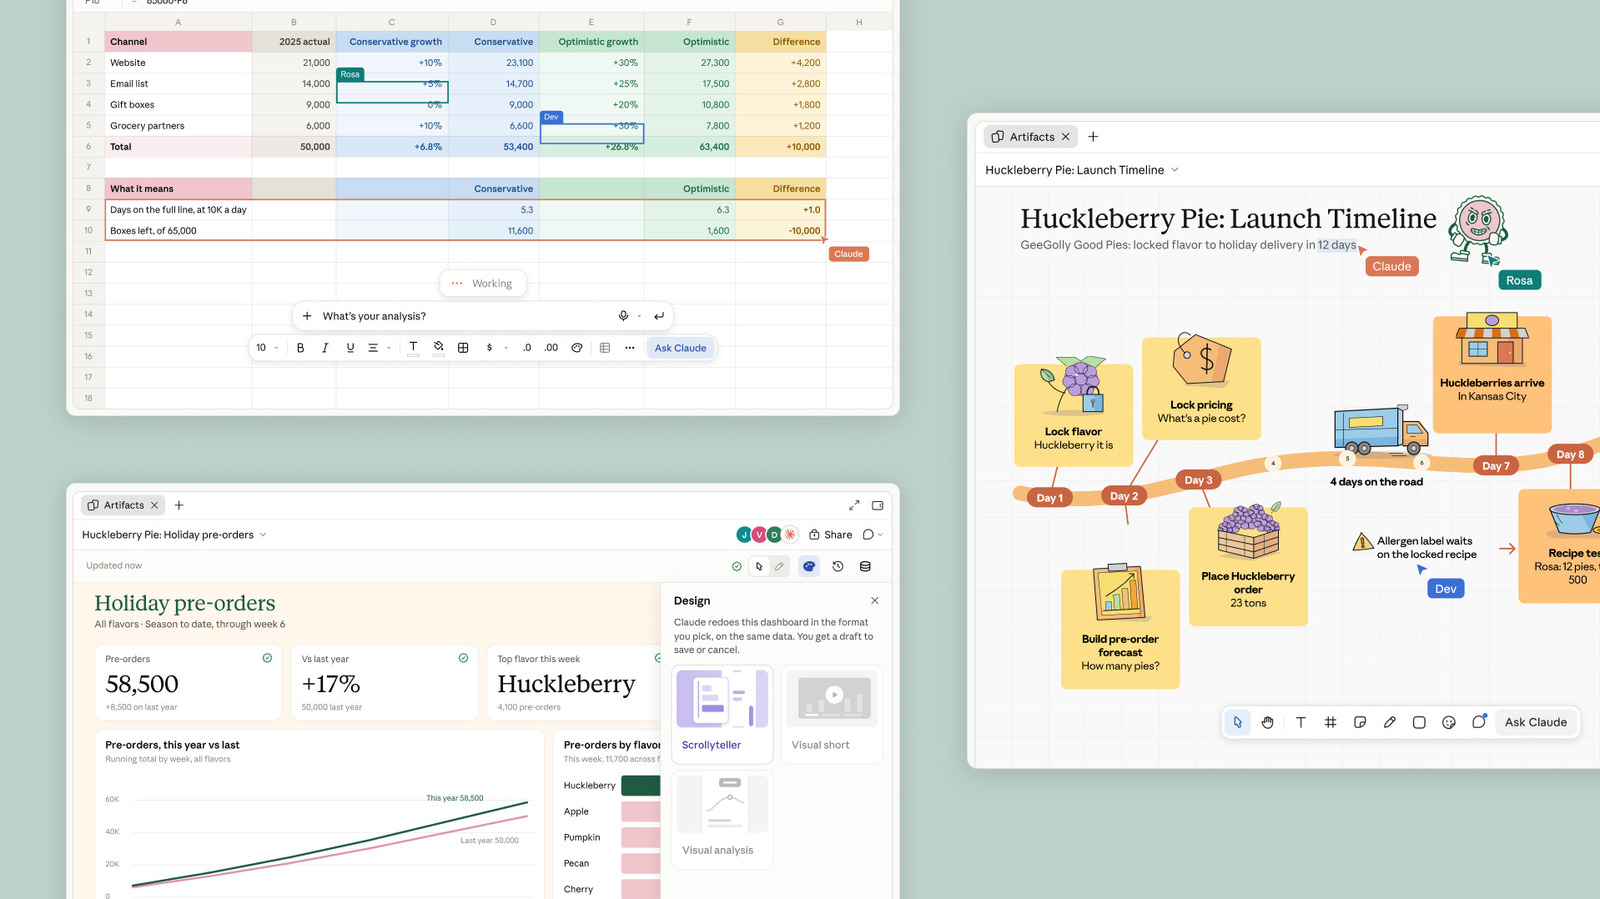
The company also has a new whiteboard app.
Sundrop is a new iPhone app that uses Apple's on-device AI to help parents rediscover their favorite photos and create keepsakes without uploading images to the cloud.
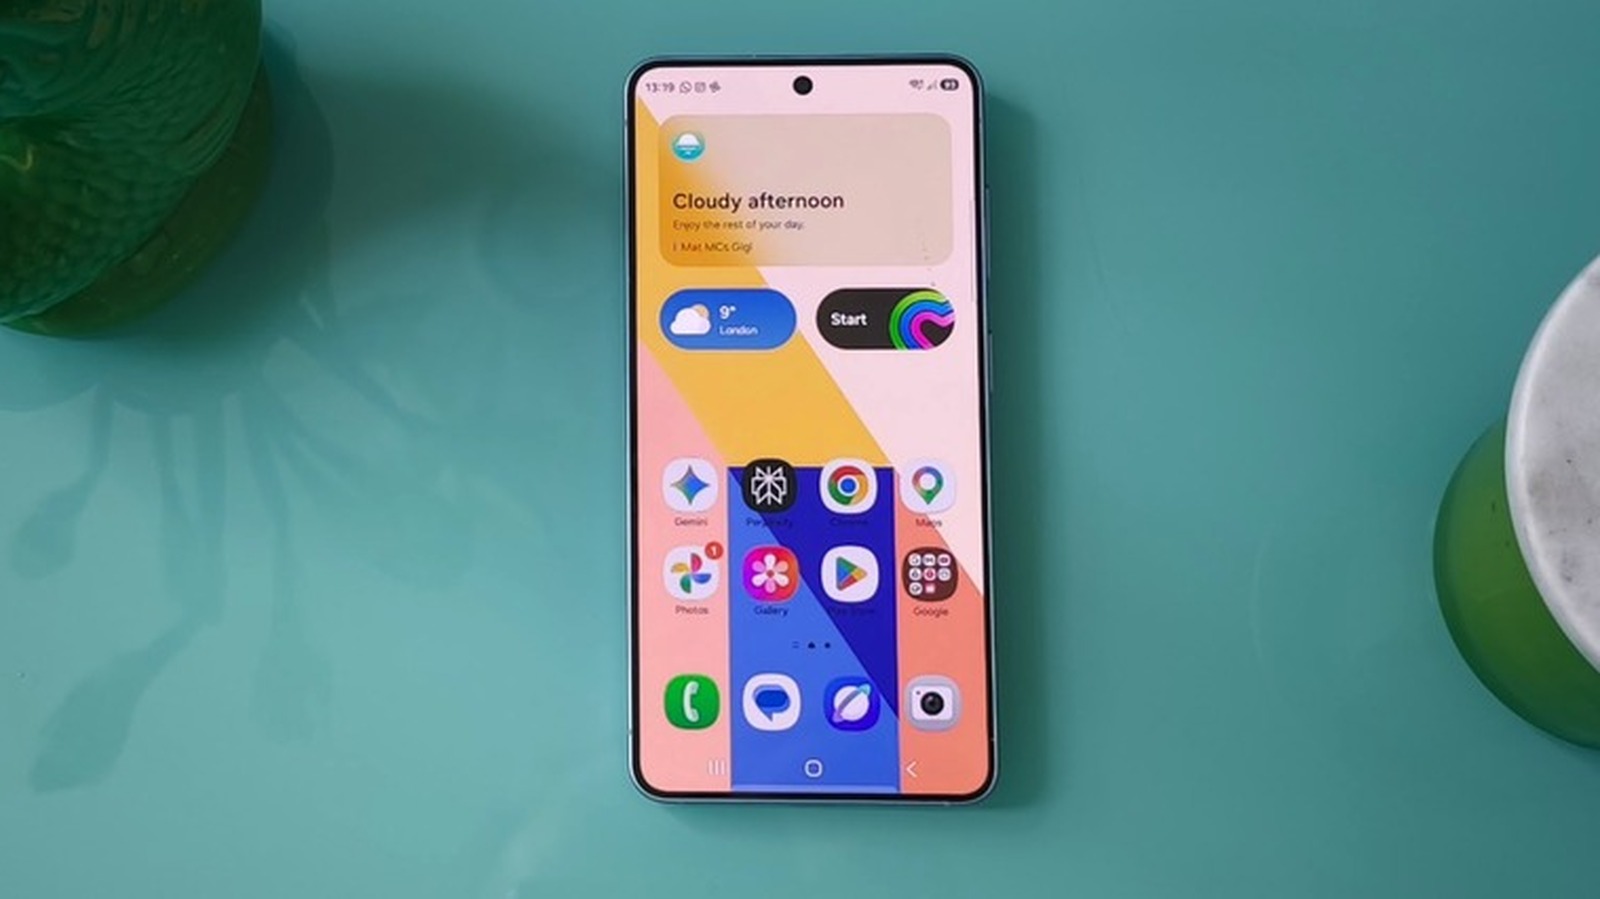
You can now sync your photos and videos on select Samsung devices to your Google account.
The gay hookup app’s premium tier Edge rolls out this month. Grindr will limit membership numbers to “preserve exclusivity.”

US and Indonesia market headlines
Markets · Nvidia
Joon Kim just joined the Wachtell Lipton law firm last month and now will lead an independent investigation into whether Nvidia’s CEO was…
Alibaba noted it had already filed confidentially on Sept. 11 to list T-Head on the Hong Kong Stock Exchange.
Isu Wapres Gibran Mundur - 383 Saham Masuk HSC, Apa Efeknya ke IHSG dan Rupiah?
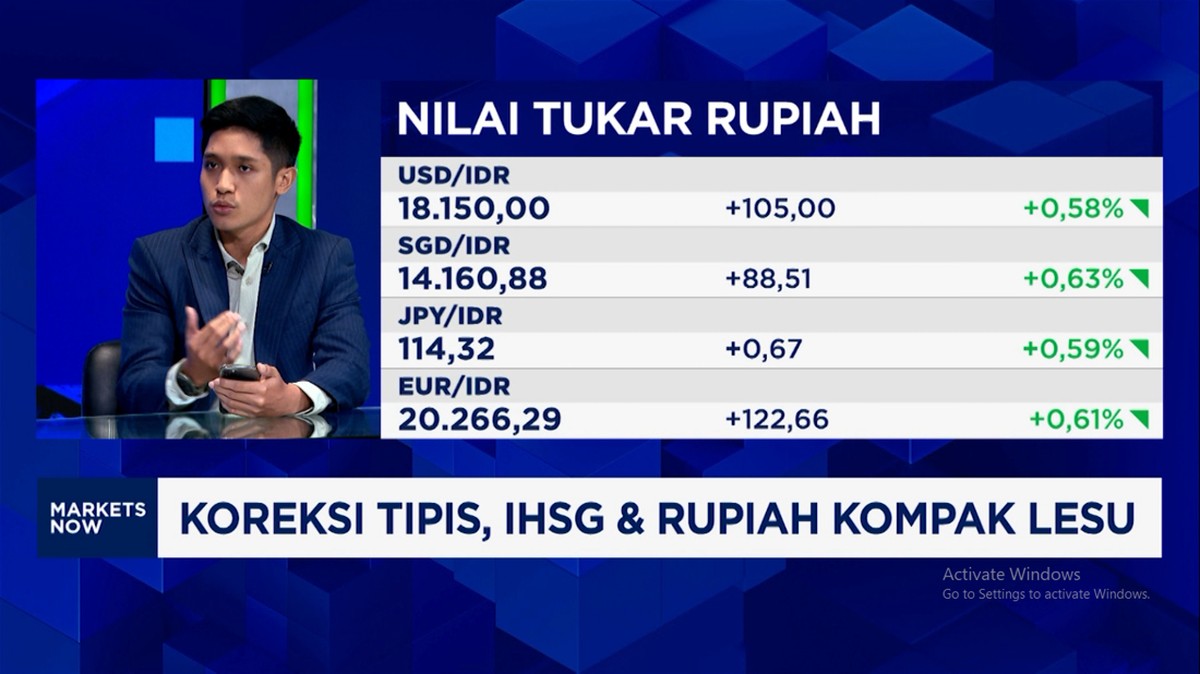
Sentimen Eksternal Bikin Investor Kabu, HSG dan Rupiah Kompak Lesu
The report comes at a critical juncture for the Federal Reserve as it considers its next move regarding interest rates.
It’s one thing for money to shift between stocks, but it’s another thing for customers to shift their supplier relationships.